Climate Change
Sharp’s Stance on Climate Change
Achieving a Net-Zero Economy
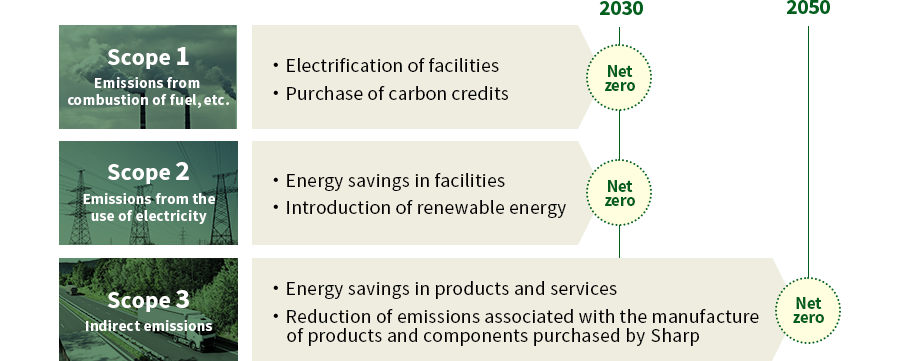
As climate change risks become more apparent and severe worldwide, society is demanding that companies take further action toward transitioning to a net-zero society. In response, we are aiming to achieve net zero CO2 emissions from our own business activities (Scopes 1 and 2) by 2030, and net zero indirect CO2 emissions outside the scope of our activities (Scope 3) by 2050. For Scope 1, we will electrify our facilities and purchase carbon credits. For Scope 2, we will save energy in facilities and introduce renewable energy. For Scope 3, we will make our products and services more energy efficient as well as strengthen cooperation with suppliers to reduce CO2 emissions associated with the manufacture of products and components we purchase.
Achieve Net Zero CO2 Emissions across the Entire Supply Chain by 2050
Addressing Climate Change through Products and Services
In line with a growth strategy that seeks to pave the way for a better future by integrating AI into every aspect of people’s lives and work, we are expanding our range of products and services that help in combating climate change, such as through optimized energy use and improved energy efficiency.
Strengthening the Energy Solutions Business
In fiscal 2025, we achieved AI-driven optimal control of storage batteries and water heaters in our Cocoro Energy cloud-based HEMS service. By automatically controlling each device according to electricity rates and buyback prices, the service helps households use electricity more efficiently and make effective use of renewable energy. We also expanded our battery storage EPC*1 business and worked on building power infrastructure that supports the spread of renewable energy. In fiscal 2026, we will further expand our energy solutions business as a growth area and roll out demand response*2 control solutions. We will contribute to reducing greenhouse gas emissions by optimizing the electricity demand of companies and facilities.
Widespread Adoption of Energy-Saving Equipment
In the air conditioning business, we are strengthening the development of high-value-added products that provide both energy efficiency and comfort. In fiscal 2025, Sharp air conditioners received high praise, including an Innovation Award in the Indoor Air Quality category at the 2026 AHR Expo, one of the world’s largest HVACR trade shows held in the United States. In fiscal 2026, we will pursue the reduction of power consumption by rolling out high-value-added products equipped with energy-saving and air quality improvement functions, mainly in the ASEAN market.
Energy and Resource Conservation through Innovative Digital Signage
In the display device business, we are pursuing ePaper business as one of our growth engines. ePaper consumes power only when the display is refreshed and consumes no power to maintain the displayed image. Therefore, it can significantly reduce power consumption compared to conventional digital signage, and, by being used as a replacement for paper posters and POP displays, it also contributes to reducing the environmental burden from printing materials and other sources. In fiscal 2026, we are pursuing further advancement in image quality, resolution, and screen size using our proprietary IGZO technology.
Balancing Climate Change Action with Business Growth
By combining energy solutions, energy-saving equipment, and digitalization solutions, we enable customers to simultaneously decarbonize their operations and solve their business challenges, thereby achieving both climate change action and sustained business growth.
- A contract format that encompasses all three elements of engineering, procurement, and construction.
- This system maintains a balance between electricity supply and demand by having the electricity demand side adjust their consumption and timing of use.
Participation in Climate Change Initiatives and Other Efforts
We participate in the Science Based Targets initiative (SBTi)*1 , which is focused on pursuing action that will achieve real and reliable results in the fight against climate change, and in March 2024 obtained SBT 1.5°C*2certification. In May 2026, we updated our targets to make them more ambitious and aligned with our decarbonization plan.
Also, in order to further accelerate our plan to convert the electricity used in our business activities to 100% renewable energy, we joined the RE100*3 global initiative in February 2025. We will contribute to decarbonization by actively introducing renewable energy at our business sites as well as further promoting the use of renewable energy throughout society through our energy solutions business.
In Japan, we will continue to participate in the Liaison Group of Japanese Electrical and Electronics Industries for Global Warming Prevention*4 and the GX Future Consortium*5 to promote initiatives by the electrical and electronics industry, along with collaborative efforts across industry, government, and academia and contribute to efforts aimed at achieving carbon neutrality for society as a whole.
- This climate change-related initiative is a collaborative effort of the United Nations Global Compact (UNGC), the CDP, World Resources Institute (WRI), and the World Wide Fund for Nature (WWF). The SBTi promotes the establishment of science-based GHG emissions reduction targets in conformance with the Paris Agreement.
- A target of limiting the increase in global average temperature to 1.5°C above pre-industrial levels.
- A global initiative that aims for companies to cover 100% of the electricity used in their operations with renewable energy.
- This group comprises companies from electrical and electronics industry associations in Japan, such as the Japan Electrical Manufacturers’ Association (JEMA) and the Japan Electronics and Information Technology Industries Association (JEITA). The Liaison Group undertakes industry-wide efforts aimed at preventing global warming—for example, proposing action plans to achieve carbon neutrality.
- This consists of the GX Future Academy, which disseminates information and conducts seminars on green transformation (GX), and the GX Future League, which works with the public and private sectors to create rules related to demand creation and funding for GX. Its aim is to drive the implementation of GX throughout society and realize a virtuous cycle of decarbonization and economic growth.


Reducing Greenhouse Gas Emissions across the Supply Chain
For greenhouse gas emissions across the entire Sharp value chain, emissions from our own activities (Scopes 1 and 2) account for 3.3%, and indirect emissions outside the scope of our activities, such as emissions associated with material procurement, transportation, and the use of sold products (Scope 3), account for 96.7%. Because of this, we recognize the importance of reducing greenhouse gas emissions across the entire supply chain, not only through our own efforts to reduce the environmental impact of our activities, like product manufacturing, but, also, through efforts to reduce the environmental impact of material procurement and product use by customers (improving product energy efficiency).
Greenhouse gas emissions from our activities are expected to decrease gradually as we make progress with the device business’ asset-light initiative. However, to ensure we achieve net zero emissions in 2030, we will continue to pursue various reduction measures and the introduction of renewable energy. As part of our reduction efforts, we are conserving energy at our production sites, such as by switching to LED lighting and improving the efficiency of outdoor air-processing units and air-conditioning systems. We are also moving forward with the use of renewable energy, such as by introducing solar power systems at our production sites both in Japan and overseas. The utilization rate of renewable energy in our electricity consumption reached 24.4% in fiscal 2025.
In materials procurement, we will further strengthen cooperation with our business partners to reduce greenhouse gas emissions.
In the field of transportation, we continue to pursue a modal shift (a switch from truck-based transportation to environmentally friendly methods like ships and railroads) while also working to optimize landing points and review our parts procurement sources.
We are actively working to create environmentally friendly products and devices whose use will result in reduced greenhouse gas emissions, as these emissions account for the largest portion across our entire supply chain. We designate our environmentally friendly products and devices as “Green Products” and “Green Devices.” We have formulated and implemented guidelines that summarize the development and design rules of these products and devices in order to ensure we are continually working to improve their environmental friendliness.
Contributing to Society through the Widespread Adoption of Renewable Energy
“As a manufacturer of products that consume electricity, we have a responsibility to become a manufacturer of electricity itself.” This has been the motivating resolve behind our work on solar power generation begun in 1959. Our efforts over the last half century have expanded into a wide range of fields, from residential use to power generation under harsh conditions in lighthouses and satellites, to mega solar power plants around the world. Based on our medium-term management plan, we will also work to develop and deepen our core technologies in the energy sector, such as solar cells for space-based applications and perovskite solar cells.
We will continue to work to further promote the use of renewable energy in all sectors of society and to contribute to the realization of a net-zero economy.
Avoided Emissions
Calculating Avoided Emissions
In addition to reducing greenhouse gas (GHG) emissions throughout our supply chain, we will contribute to reducing those emissions throughout society by switching to innovative products with improved energy efficiency. This initiative is calculated as “avoided emissions*1.”
Avoided emissions are the amount of GHG emissions reduced in society as a result of the use of a company’s energy-saving products and services. They are a new indicator for evaluating a company’s ability to address climate change through the solutions it provides. This fiscal year, electronic paper displays and LED displays were added to the products included in the calculation, and our avoided emissions in fiscal 2025 were 140,000 t-CO2.
Avoided Emissions Calculation Method
With reference to various guidelines and case studies on avoided emissions*2, we utilize the following approach to calculating avoided emissions.
Avoided Emissions (Fiscal 2025)
| Avoided emissions type | Products subject to calculation | Avoided emissions (thousand tons CO2) |
|---|---|---|
| Replacement with energy-saving products | TVs, air conditioners, refrigerators, washing machines, microwave ovens, laundry dryers/dehumidifiers, electronic paper displays, LED displays | 140 |
Baseline: Comparison with the average product on the market in the calculation year*3
The CO2 equivalent of the electricity consumed by an average product with equivalent functionality to Sharp’s products in the market in the country or region where it is sold in the fiscal year of calculation.
Calculation formula: Calculated using the following two formulas
ⅰ) When the majority of GHG emissions occur during the use phase of the product life cycle:
(Annual power consumption of average products on the market – Annual power consumption of Sharp products*4) × CO2 emissions factor associated with electricity usage*5 × Annual sales volume of Sharp products × Lifetime
ii) Cases other than those described in i) above:
{(Annual power consumption of average products on the market – Annual power consumption of Sharp products*4) × CO2 emissions factor associated with electricity usage*5 × Annual sales volume of Sharp products × Lifetime} +
{(Life cycle emissions excluding the use phase of average products on the market – Life cycle emissions excluding the use phase of Sharp products) × Annual sales volume of Sharp products}
- Avoided emissions have a different purpose and calculation method from the emissions from a company’s own activities (Scopes 1 and 2) and indirect emissions outside the scope of a company’s activities (Scope 3) and does not offset these.
- Guidance on Avoided Emissions v2.0 (WBCSD, July 2025), IEC63372 (IEC, January 2026)
- Based on regulations and survey results (including Sharp’s own findings) in the country and region where the product is sold.
- We use regulations and survey results from the country and region in which each product is sold (including Sharp’s own findings and calculations).
- Uses the total CO2 emissions factor associated with electricity consumption in the country or region where the product is sold (IEA Emissions Factor 2025).
Energy-Saving Refrigerator Operation Using AI
Sharp refrigerators can save up to approximately 25% on electricity consumption. By connecting the refrigerator to a wireless LAN and using the Connect to Save More*6 cloud service function, energy savings can be increased to up to approximately 35% compared to normal operation. The refrigerator learns usage patterns and automatically optimizes energy-saving operation tailored to each household’s lifestyle. The Life Eee Connect*6 energy management service, which links a solar power system with home appliances and residential equipment, optimizes the refrigerator’s defrosting operation. By efficiently utilizing solar power, this service reduces wasted electricity.


- Although Connect to Save More and Life Eee Connect were not reflected in this calculation, it is expected that the utilization of these technologies will reduce the amount of power consumed during product use, leading to further reductions in CO2 emissions.
TCFD-Based Information Disclosure
Action on the TCFD Recommendations
The Task Force on Climate-related Financial Disclosures (TCFD) was established by the Financial Stability Board (FSB), an organization promoting international financial stability. In 2017 the TCFD released recommendations for companies to disclose information on the risks and opportunities of climate change. We have declared support for the TCFD recommendations and are expanding disclosure of climate-related information in accordance with the framework set by the TCFD.

1. Governance
Climate-related issues are monitored and countermeasures supervised by the president & CEO, who chairs the Sustainability Committee. The committee includes senior executives and members from head office departments, business units, and subsidiaries. The committee works to thoroughly implement policies and visions related to aspects of ESG such as climate change; it deliberates on and promotes active measures; and it shares the latest trends on societal issues.
Through monitoring and review by management at committee meetings, we continuously strengthen climate change action to play a part in making society sustainable.
2. Strategy
We see climate change as both a risk and an opportunity in the medium to long term. We assess our strategies and organizational resilience considering climate-related risks and opportunities. To understand long-term impacts up to 2050, we analyzed climate change scenarios outlined by the International Energy Agency (IEA) and the Intergovernmental Panel on Climate Change (IPCC) (1.5°C scenario*1 and 4°C scenario*2). Detailed information about those risks and opportunities, along with a summary of associated measures are found below.
3. Risk Management
We identify and assess climate-related risks in accordance with the Rules of Business Risk Management, in which the basic approach to risk management has been established. Specifically, we identify climate-related risks that are highly likely to occur based on our analysis of climate scenarios forecast for the future. The findings are reported as necessary to senior executives and the Internal Control Planning Division, which serves as the risk management secretariat. It also facilitates necessary improvement measures in partnership with involved departments.
4. Metrics and Targets
In 2019 we formulated SHARP Eco Vision 2050, a long-term environmental vision based on our basic environmental policy of “Creating an environmentally conscious company with sincerity and creativity,” which was established in 1992. We are working toward realizing a sustainable global environment by pursuing long-term goals set in three fields of action with 2050 as the target year: climate change, resource recycling, and safety and security. With regard to the pressing global issue of climate change, we are accelerating efforts to achieve net zero CO2 emissions from our business activities (Scopes 1 and 2) by 2030, and from our entire supply chain (Scopes 1, 2, and 3) by 2050.
- IEA Net Zero Emissions by 2050 Scenario; SSP1-1.9 scenario from the IPCC 6th Assessment Report (AR6).
- RCP 8.5 scenario from the IPCC 5th Assessment Report (AR5).
Progress towards Reducing GHG Emissions (Fiscal 2025 Results)
| Base Year (fiscal 2021 results) |
Fiscal 2025 Results | Base Year Comparison |
|---|---|---|
| 1,365 thousand tons CO2 | 600 thousand tons CO2 | 56.0% reduction |
Business Risks and Opportunities; Sharp’s Response
| Scenario | Factors | Changes | Impacts on Sharp | Risk or Opportunity | Degree of Financial Impact | Time Horizon* | Sharp's Response |
|---|---|---|---|---|---|---|---|
| 1.5℃ | Introduction of carbon pricing | Increased raw material procurement costs | Costs passed on to purchase prices due to carbon tax levied on Sharp-purchased products | Risk | Large | Short term |
|
| Increased direct operational costs | Increased payment costs due to carbon tax levied in line with Sharp’s GHG emissions | Risk | Large | Short term |
|
||
| Pressure to decarbonize and pursue environmental friendliness in the supply chain | Decline in competitiveness due to failure to meet user needs for environmental friendliness | Decrease in sales due to failure to meet user expectations for environmental friendliness | Risk | Medium | Short term |
|
|
| Increased costs associated with switching to environmentally friendly materials | Increased costs associated with switching to electric furnace materials, recycled plastic, and bio-plastic, which emit less GHGs | Risk | Medium | Medium term |
|
||
| Increased energy procurement costs due to switching to renewable energy | Increased costs associated with in-house power generation, power purchase agreements (PPA), switching to renewable energy, and purchase of environmental value certificates | Risk | Small | Medium term |
|
||
| Expansion of the renewable energy market | Increased demand for solar power-related products and systems from producers and users of renewable energy | Increased possibility for revenue growth by expanding product and system offerings | Opportunity | Medium | Short term |
|
|
| Increased demand for zero energy houses (ZEH) | Increased possibility for revenue growth by strengthening offerings of flat-rate solar power services for homes and home energy management systems (HEMS) | Opportunity | Medium | Short term |
|
||
| Expansion of environmentally beneficial businesses | Expansion of circular economy business models | Increased support from customers by establishing a waste-free circular economy business model, amid growing efforts for decarbonization in society | Opportunity | Small | Medium term |
|
|
| 4℃ | Intensifying weather-driven disasters | Disruptions in the supply chain | Intensifying weather-driven disasters affect Sharp suppliers and bases and the supply chain, leading to a loss in sales opportunities for Sharp | Risk | Medium | Long term |
|
- Short term: three years or less; medium term: by around 2030; long term: by around 2050.
Greenhouse Gas Emissions
We calculate greenhouse gas emissions with reference to the GHG Protocol*1 and then work to limit those emissions across the entire supply chain.*2
Greenhouse Gas Emissions by Scope 1/2/3 Categories Based on the GHG Protocol
| Category | Emissions(Thousand Tons CO2) | Notes | |||
|---|---|---|---|---|---|
| Fiscal 2023 | Fiscal 2024 | Fiscal 2025 | |||
| Scope 1 (direct GHG emissions from business activities) | 290 | 260 | 218 | Emissions from combustion of fuel, etc. | |
| Scope 2 (indirect GHG emissions from usage in business activities) | Market-based | 885 | 560 | 382 | Emissions from the use of electricity (calculated using contract-specific emission factors) |
| Location-based | 1,005 | 765 | 512 | Emissions from the use of electricity (calculated using the average emission factor of each region) | |
| Total of Scope 1 and Scope 2 | 1,175 | 820 | 600 | Scope 2: market-based | |
| Scope 3 (indirect GHG emissions from outside the scope of business activities) |
1. Purchased goods and services | 2,480 | 1,879 | 2,274 | Emissions from the manufacture of materials procured for products sold in the reporting year |
| 2. Capital goods | 130 | 82 | 84 | Emissions from the construction, manufacture, and transportation of capital goods (such as equipment, machinery buildings, facilities, and vehicles) | |
| 3. Fuel- and energy-related activities (not included in Scope 1 or 2) | 219 | 150 | 117 | Emissions from the procurement of fuels (natural resource extraction, manufacture, and transportation) consumed in the generation of electricity and heat procured from other companies | |
| 4. Upstream transportation and distribution | 164 | 153 | 69 | Emissions from the transportation of parts and materials and products manufactured | |
| 5. Waste generated in operations | 2 | 2 | 1 | Emissions from waste disposal and treatment | |
| 6. Business travel | 19 | 16 | 13 | Emissions from business travel by all employees | |
| 7. Employee commuting | 17 | 15 | 14 | Emissions from commuting by all employees | |
| 8. Upstream leased assets | - | - | - | Included in Scope 1 and 2 emissions | |
| 9. Downstream transportation and distribution | 63 | 46 | 59 | Emissions from the transportation (from retailers to end consumers) of products sold in the reporting year | |
| 10. Processing of sold products | 201 | 44 | 171 | Emissions from processing at destination of products | |
| 11. Use of sold products | 19,110 | 19,337 | 14,692*3 | Emissions from the use of products sold in the reporting year | |
| 12. End-of-life treatment of sold products | 763 | 809 | 326 | Emissions from recycling 4 types of appliances*4, copiers/MFPs, and PCs, as well as emissions of refrigerants when disposing of air conditioners | |
| 13. Downstream leased assets | - | - | - | Not applicable | |
| 14. Franchises | - | - | - | Not applicable | |
| 15. Investments | - | - | - | Not applicable | |
| Scope 3 total | 23,168 | 22,533 | 17,820 | ||
| Scope 1 + 2 + 3 total | 24,343 | 23,353 | 18,420 | ||
- The GHG Protocol is an international standard for calculating greenhouse gas (GHG) emissions. It was jointly established by the World Business Council for Sustainable Development (WBCSD), a coalition of the world’s leading companies, and the World Resources Institute (WRI), a United States-based think tank.
- Scopes 1 and 2 are calculated for Sharp Corporation production sites and production subsidiaries in Japan and overseas. Scope 3 is calculated for Sharp’s entire supply chain.
- The calculation method was revised beginning with fiscal 2025 results.
- TVs (CRT TVs, flat-panel TVs), air conditioners, refrigerators/freezers, washing machines/dryers
Reducing Business Activity-Linked Greenhouse Gas Emissions
| Fiscal 2025 Objectives | Fiscal 2025 Achievements | Self-Evaluation | Priority Objectives for Fiscal 2026 |
|---|---|---|---|
|
|
★★★ |
|
- Self-evaluation: ★★★ Achieved more than targeted / ★★ Achieved as targeted / ★ Achieved to some extent
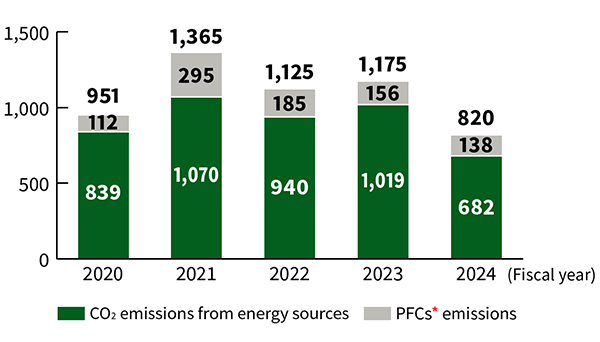
To address the global problem of climate change, we are working to reduce GHG emissions from our business activities. We aim to achieve net zero CO2 emissions from business activities by 2030. The Sharp Group’s GHG emissions from business activities in fiscal 2025 were down 56.0% to 600,000 tons CO2 compared to the fiscal 2021 baseline.
In addition to energy-saving actions at each site, we are using non-fossil certificates and other means to reduce the amount of greenhouse gas emissions. As well, progress in making the device business more asset-light allowed us to dramatically reduce emissions.
We will continue to achieve targets by, for example, making production lines more efficient and introducing renewable energy.
Sharp Group’s GHG Emissions from Business Activities
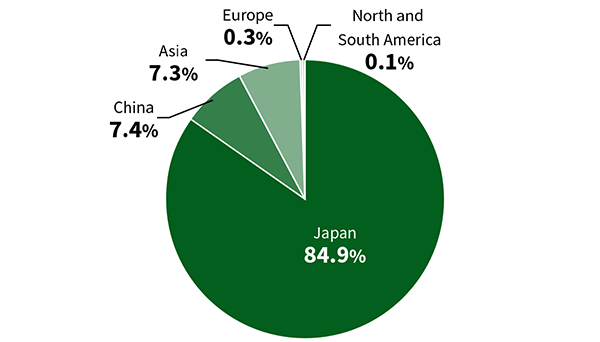
GHG Emissions by Region (Fiscal 2025)
Reducing Greenhouse Gas Emissions at Production Sites
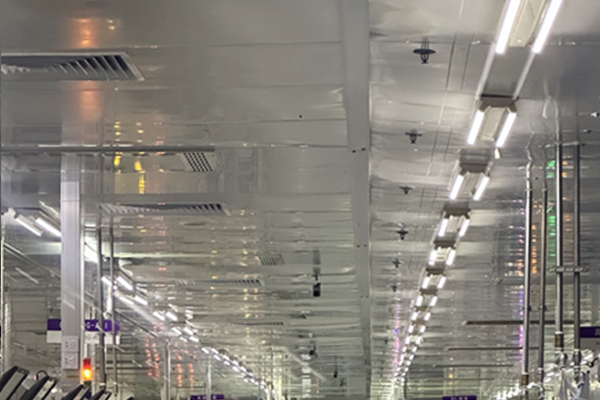
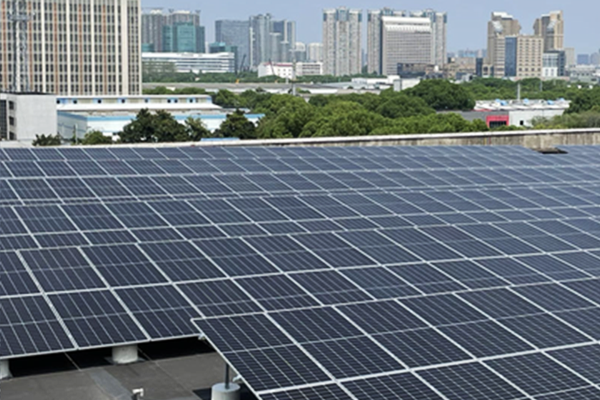
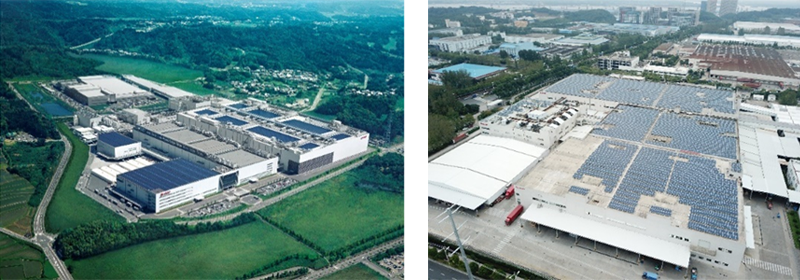
Production base WSEC in China has upgraded the electronic control system for the factory’s air conditioning equipment and implemented total optimization control. It also takes other energy-saving measures, like replacing factory lights with LED lamps. In addition, a solar power system with an output of 2 MW-dc and annual power generation of 2,528 MWh was installed on the factory roof. As a result of these efforts, greenhouse gas emissions were reduced by approximately 4,000 t-CO2 in fiscal 2025.
At Sharp, we are actively pursuing energy-saving initiatives and the introduction of solar power systems at our domestic and overseas bases as we work to reduce greenhouse gas emissions globally.
Product Life Cycle Assessment
Identifying and Reducing Environmental Impacts throughout the Life of Products
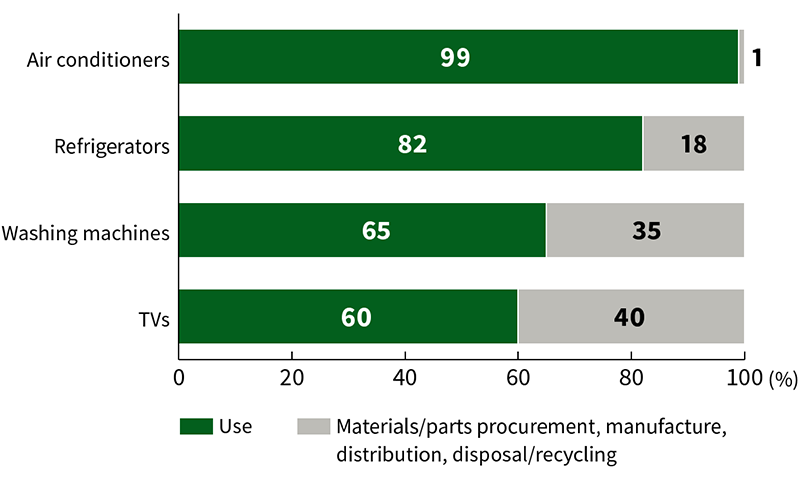
We do a life cycle* assessment (LCA) on our products to identify their impact on the environment throughout their life cycle. The results are used in product planning and development.
Consumer electronics generally have a large impact on the environment during use. Thus, by focusing on improving their energy savings, overall environmental impact can be effectively reduced.
- The life of a product from materials and parts procurement to manufacture, distribution, use, disposal, and recycling.
Life Cycle CO2 Emissions by Percentage of the 4 Types of Appliances
Utilizing Renewable Energy
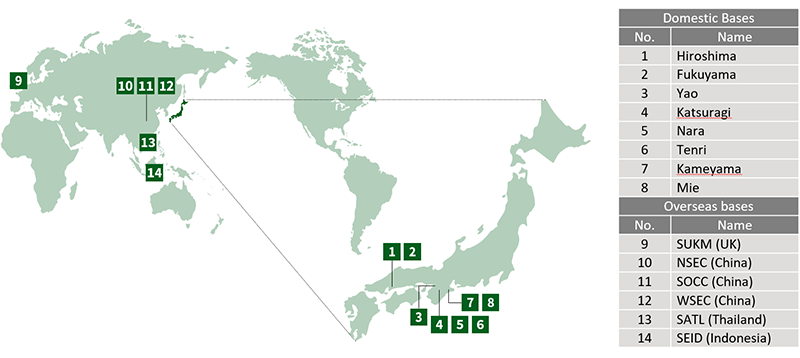
We have introduced the use of PV systems and other power sources to our domestic and overseas production bases and are advancing the use of renewables to do our part to create a net-zero society. In fiscal 2025, the amount of renewable energy was 262.67 million kWh. The proportion of renewable energy in our electricity consumption increased to 24.4%. In-house solar power generation was 5.92 million kWh.
Solar Power Systems at Sharp Bases Worldwide
Reducing Logistics-Related Environmental Impact
Reducing the Environmental Impact of Logistics in Japan
We observe a rule set forth in the Japanese Energy Conservation Act*1 that requires specified shippers to reduce energy intensity by 1% or greater per year. All Sharp Group companies in Japan are working to reduce the environmental impact and costs associated with logistics.
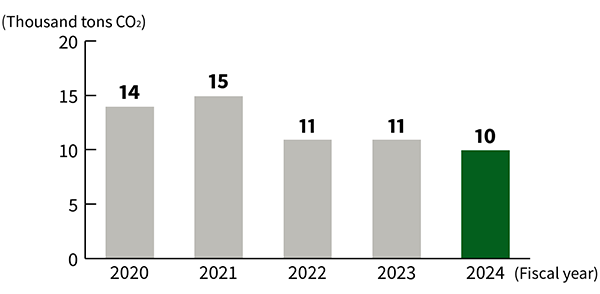
In fiscal 2025, Sharp Group greenhouse gas (GHG) emissions from shipping activities in Japan were 9,000 tons CO2. For Sharp Corporation, energy intensity worsened by an average of 1% for the most recent five years (fiscal 2021 to 2025) due to a decrease in net sales.
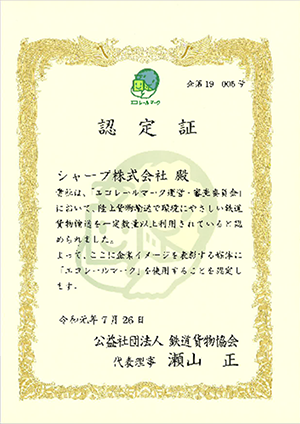
We are steadily implementing a modal shift*2, a change from conventional trucking to more environmentally friendly modes of transport, such as shipping (non-international coastal trading vessels) and rail (Japan Railways containers). And, by unloading imported goods at harbors chosen for their proximity to their main sales locations, we are reducing re-transport between distribution centers. These efforts enable us to reduce the environmental impact of our distribution activities. For shipments, we have been certified with an Eco Rail Mark*3 by the Ministry of Land, Infrastructure, Transport, and Tourism and the Railway Freight Association.
- Act on Rationalization of Energy Use and Shift to Non-Fossil Energy
- To shift freight transport from conventional trucking to more environmentally friendly modes of transport, such as rail and shipping.
- Products or companies that use a certain amount of rail transport for freight are given Eco Rail Mark certification. The mark is used on items such as product packaging and brochures to inform the public that a company uses environmentally friendly modes of transport.
GHG Emissions from Freight Shipments (Japan)
Reducing the Environmental Impact of International Logistics
We have a wide range of initiatives to reduce the amount of GHGs that are emitted as a result of international shipping. We are reducing airfreight volume as we switch to environmentally friendly modes of transport, and we are also improving load efficiency. Further, we are reviewing shipping routes and switching to harbors that are closer to the final destinations for products. We are also switching to suppliers located closer to our factories.